Topic 2: Manipulating Data
1. Spec 95 / T1(new) - Qu 7:
(a): Explain how the quartiles of a distribution can help to describe the shape of the distribution
Summarised below are the masses of new potatoes in grams:
Mass (g) │ Frequency
────────────┼──────────
19 or less │ 2
20-29 │ 14
30-39 │ 21
40-44 │ 34
45-49 │ 39
50-59 │ 42
60-69 │ 13
70-79 │ 9
80-89 │ 4
90 or more │ 2
(b): Use interpolation to estimate the median and quartiles of this distribution
Hence describe its skewness
(c): Draw a box and whisker plot
(d): Explain why, for these data, the median and quartiles is preferred to the mean and standard deviation
Clues:
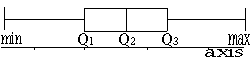
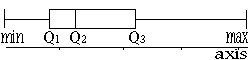
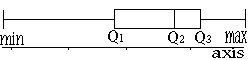
Part (a): A box-plot shows the skewness of a set of data:
When data is symmetrical, (Q3-Q2) = (Q2-Q1) and the box-plot looks like this:
 When data is +ve skew, (Q3-Q2) > (Q2-Q1) and the box-plot looks like this:
 When data is -ve skew, (Q3-Q2) < (Q2-Q1) and the box-plot looks like this:
 Part (b): This is a good question to show you all the things you need to know about handling data:
Step 1: Make sure all of the classes are closed:
In this table, the 1st and last classes are "open classes"
We need to add in a lower limit for the 1st class and an upper limit for the
last class before we convert to class boundaries: Any reasonable guess is OK
Mass (g) │ Frequency
──────────┼──────────
0 - 19 │ 2
20 - 29 │ 14
30 - 39 │ 21
40 - 44 │ 34
45 - 49 │ 39
50 - 59 │ 42
60 - 69 │ 13
70 - 79 │ 9
80 - 89 │ 4
90 - 99 │ 2
Step 2: Make sure the data is written using CLASS BOUNDARIES:
In this table, the 1st class ends at ‘19’, but the second class starts at ‘20’
There should be no gap between the end of one class and the start of the next class!
So, to convert to CLASS BOUNDARIES, we use the number halfway between the end of
each class and the start of the next class (so in that case, halfway between 19 & 20
would be 19.5)
Note: The method is different if the variable is AGE, because AGE is always rounded down
Class Limits │ Class Boundaries │ Frequency
─────────────┼───────────────────┼──────────
0 - 19 │ - 19.5 │ 2
20 - 29 │ 19.5 - │ 14
Repeating for the rest of the classes:
Class Limits │ Class Boundaries │ Frequency
─────────────┼───────────────────┼──────────
0 - 19 │ - 19.5 │ 2
20 - 29 │ 19.5 - 29.5 │ 14
30 - 39 │ 29.5 - 39.5 │ 21
40 - 44 │ 39.5 - 44.5 │ 34
45 - 49 │ 44.5 - 49.5 │ 39
50 - 59 │ 49.5 - 59.5 │ 42
60 - 69 │ 59.5 - 69.5 │ 13
70 - 79 │ 69.5 - 79.5 │ 9
80 - 89 │ 79.5 - 89.5 │ 4
90 - 99 │ 89.5 - │ 2
The first and last class follow the same pattern as the rest (i.e. the lower class limit
has 0.5 knocked off it and the upper class limit has 0.5 added to it):
Class Limits │ Class Boundaries │ Frequency
─────────────┼───────────────────┼──────────
0 - 19 │ -0.5 - 19.5 │ 2
20 - 29 │ 19.5 - 29.5 │ 14
30 - 39 │ 29.5 - 39.5 │ 21
40 - 44 │ 39.5 - 44.5 │ 34
45 - 49 │ 44.5 - 49.5 │ 39
50 - 59 │ 49.5 - 59.5 │ 42
60 - 69 │ 59.5 - 69.5 │ 13
70 - 79 │ 69.5 - 79.5 │ 9
80 - 89 │ 79.5 - 89.5 │ 4
90 - 99 │ 89.5 - 99.5 │ 2
So now the table looks like this (it should have looked like this from the start):
Mass (g) │ Frequency
───────────────┼──────────
-0.5 - 19.5 │ 2
19.5 - 29.5 │ 14
29.5 - 39.5 │ 21
39.5 - 44.5 │ 34
44.5 - 49.5 │ 39
49.5 - 59.5 │ 42
59.5 - 69.5 │ 13
69.5 - 79.5 │ 9
79.5 - 89.5 │ 4
89.5 - 99.5 │ 2
Step 3: To find the MEDIAN, we need a Cumulative Frequency Table:
Use the UPPER BOUNDARY of each class and the ‘running total’ of the frequencies
U.C.B. │ Frequency
───────────────┼──────────
19.5 │ 2
29.5 │ 16 ◄─── 2 + 14
39.5 │ 37 ◄─── 2 + 14 + 21
44.5 │ 71 ◄─── 2 + 14 + 21 + 34
49.5 │ 110 ◄─── 2 + 14 + 21 + 34 + 39
59.5 │ 152 ◄─── 2 + 14 + 21 + 34 + 39 + 42
69.5 │ 165 ◄─── 2 + 14 + 21 + 34 + 39 + 42 + 13
79.5 │ 174 ◄─── 2 + 14 + 21 + 34 + 39 + 42 + 13 + 9
89.5 │ 178 ◄─── 2 + 14 + 21 + 34 + 39 + 42 + 13 + 9 + 4
99.5 │ 180 ◄─── 2 + 14 + 21 + 34 + 39 + 42 + 13 + 9 + 4 + 2
Step 4: The median is the ½(n+1)th value:
n = 180; so the median is the 90.5th value
Note: As n is so large, you could just use ½n for the median (i.e. the 90th value)
Make space within the C.F. table to insert this:
U.C.B. │ Frequency
───────────────┼──────────
19.5 │ 2
29.5 │ 16
39.5 │ 37
44.5 │ 71
median │ 90.5
49.5 │ 110
59.5 │ 152
69.5 │ 165
79.5 │ 174
89.5 │ 178
99.5 │ 180
Step 5: Use "interpolation":
Find the ‘differences’ and use: small difference = small difference
big difference big difference
U.C.B. │ Frequency
───────────────┼──────────
19.5 │ 2
29.5 │ 16
39.5 │ 37
┌── ┌─ 44.5 │ 71 ────┐───────┐
+5│ x└─► median │ 90.5 ◄─┘+19.5 │+39
└────► 49.5 │ 110 ◄───────────┘
59.5 │ 152
69.5 │ 165
79.5 │ 174
89.5 │ 178
99.5 │ 180
So: x = 19.5
5 39 .
Which gives x = …
And the median is then found by:
U.C.B. │ Frequency
───────────────┼──────────
19.5 │ 2
29.5 │ 16
39.5 │ 37
┌─ 44.5 │ 71
+…└─► median │ 90.5
49.5 │ 110
59.5 │ 152
69.5 │ 165
79.5 │ 174
89.5 │ 178
99.5 │ 180
Median = 44.5 + … = ...
Step 6: Q1 is the (¼n + ½)th value {some schools wrongly say it is the ¼(n+1)th value}
n = 180; so the Q1 is the 45.5th value
Note: As n is so large, you could just use ¼n for the Q1 (i.e. the 45th value)
We use the same method as we did to find the median, firstly making space within the
C.F. table to insert this:
U.C.B. │ Frequency
───────────────┼──────────
19.5 │ 2
29.5 │ 16
39.5 │ 37
Q1 │ 45.5
44.5 │ 71
49.5 │ 110
59.5 │ 152
69.5 │ 165
79.5 │ 174
89.5 │ 178
99.5 │ 180
And then using "interpolation" again…
Which gives: Q1 = 40.75, Q2 = 90.5, Q3 = 55.07
Note: You get slightly different answers for Q1, Q2 and Q3 if you use ¼n, ½n and ¾n to find them,
but the examiner will accept either - this is stats and approximations are part of the game!
(Q3 - Q2) = 8.57
(Q2 - Q1) = 6.25
(Q3-Q2) > (Q2-Q1), which shows "slight +ve skew"
Part (c): Question does not ask us to find outliers - so we won't bother
Box-plot: min = 9.5; Q1 = 40.75; Q2 = 47; Q3 = 55.07; Max = 94.5
Note: (for clever students only) It's not really correct to use the mid-values of the 1st and last classes
for the min and max values…
The proper thing to do with grouped data is to find the 5th percentile (P5)
and the 95th percentile (P95)
The 5th percentile is the ( 5 × n)th value (i.e. the 9th value)
100
We then use the same method as above (interpolation) to estimate this: P5 = 19.5 + 6.43 = 25.93
The 95th percentile is the ( 95 × n)th value (i.e. the 171th value)
100
We then use the same method as above (interpolation) to estimate this: P95 = 69.5 + 6.67 = 76.17
When we use the 5th and 95th percentiles (instead of the actual lowest and highest values),
we draw out box-plot slightly differently, using arrows at then ends:
┌──────────┬──────────┐
◄────────────┤ │ ├────────►
Part (b): This is a good question to show you all the things you need to know about handling data:
Step 1: Make sure all of the classes are closed:
In this table, the 1st and last classes are "open classes"
We need to add in a lower limit for the 1st class and an upper limit for the
last class before we convert to class boundaries: Any reasonable guess is OK
Mass (g) │ Frequency
──────────┼──────────
0 - 19 │ 2
20 - 29 │ 14
30 - 39 │ 21
40 - 44 │ 34
45 - 49 │ 39
50 - 59 │ 42
60 - 69 │ 13
70 - 79 │ 9
80 - 89 │ 4
90 - 99 │ 2
Step 2: Make sure the data is written using CLASS BOUNDARIES:
In this table, the 1st class ends at ‘19’, but the second class starts at ‘20’
There should be no gap between the end of one class and the start of the next class!
So, to convert to CLASS BOUNDARIES, we use the number halfway between the end of
each class and the start of the next class (so in that case, halfway between 19 & 20
would be 19.5)
Note: The method is different if the variable is AGE, because AGE is always rounded down
Class Limits │ Class Boundaries │ Frequency
─────────────┼───────────────────┼──────────
0 - 19 │ - 19.5 │ 2
20 - 29 │ 19.5 - │ 14
Repeating for the rest of the classes:
Class Limits │ Class Boundaries │ Frequency
─────────────┼───────────────────┼──────────
0 - 19 │ - 19.5 │ 2
20 - 29 │ 19.5 - 29.5 │ 14
30 - 39 │ 29.5 - 39.5 │ 21
40 - 44 │ 39.5 - 44.5 │ 34
45 - 49 │ 44.5 - 49.5 │ 39
50 - 59 │ 49.5 - 59.5 │ 42
60 - 69 │ 59.5 - 69.5 │ 13
70 - 79 │ 69.5 - 79.5 │ 9
80 - 89 │ 79.5 - 89.5 │ 4
90 - 99 │ 89.5 - │ 2
The first and last class follow the same pattern as the rest (i.e. the lower class limit
has 0.5 knocked off it and the upper class limit has 0.5 added to it):
Class Limits │ Class Boundaries │ Frequency
─────────────┼───────────────────┼──────────
0 - 19 │ -0.5 - 19.5 │ 2
20 - 29 │ 19.5 - 29.5 │ 14
30 - 39 │ 29.5 - 39.5 │ 21
40 - 44 │ 39.5 - 44.5 │ 34
45 - 49 │ 44.5 - 49.5 │ 39
50 - 59 │ 49.5 - 59.5 │ 42
60 - 69 │ 59.5 - 69.5 │ 13
70 - 79 │ 69.5 - 79.5 │ 9
80 - 89 │ 79.5 - 89.5 │ 4
90 - 99 │ 89.5 - 99.5 │ 2
So now the table looks like this (it should have looked like this from the start):
Mass (g) │ Frequency
───────────────┼──────────
-0.5 - 19.5 │ 2
19.5 - 29.5 │ 14
29.5 - 39.5 │ 21
39.5 - 44.5 │ 34
44.5 - 49.5 │ 39
49.5 - 59.5 │ 42
59.5 - 69.5 │ 13
69.5 - 79.5 │ 9
79.5 - 89.5 │ 4
89.5 - 99.5 │ 2
Step 3: To find the MEDIAN, we need a Cumulative Frequency Table:
Use the UPPER BOUNDARY of each class and the ‘running total’ of the frequencies
U.C.B. │ Frequency
───────────────┼──────────
19.5 │ 2
29.5 │ 16 ◄─── 2 + 14
39.5 │ 37 ◄─── 2 + 14 + 21
44.5 │ 71 ◄─── 2 + 14 + 21 + 34
49.5 │ 110 ◄─── 2 + 14 + 21 + 34 + 39
59.5 │ 152 ◄─── 2 + 14 + 21 + 34 + 39 + 42
69.5 │ 165 ◄─── 2 + 14 + 21 + 34 + 39 + 42 + 13
79.5 │ 174 ◄─── 2 + 14 + 21 + 34 + 39 + 42 + 13 + 9
89.5 │ 178 ◄─── 2 + 14 + 21 + 34 + 39 + 42 + 13 + 9 + 4
99.5 │ 180 ◄─── 2 + 14 + 21 + 34 + 39 + 42 + 13 + 9 + 4 + 2
Step 4: The median is the ½(n+1)th value:
n = 180; so the median is the 90.5th value
Note: As n is so large, you could just use ½n for the median (i.e. the 90th value)
Make space within the C.F. table to insert this:
U.C.B. │ Frequency
───────────────┼──────────
19.5 │ 2
29.5 │ 16
39.5 │ 37
44.5 │ 71
median │ 90.5
49.5 │ 110
59.5 │ 152
69.5 │ 165
79.5 │ 174
89.5 │ 178
99.5 │ 180
Step 5: Use "interpolation":
Find the ‘differences’ and use: small difference = small difference
big difference big difference
U.C.B. │ Frequency
───────────────┼──────────
19.5 │ 2
29.5 │ 16
39.5 │ 37
┌── ┌─ 44.5 │ 71 ────┐───────┐
+5│ x└─► median │ 90.5 ◄─┘+19.5 │+39
└────► 49.5 │ 110 ◄───────────┘
59.5 │ 152
69.5 │ 165
79.5 │ 174
89.5 │ 178
99.5 │ 180
So: x = 19.5
5 39 .
Which gives x = …
And the median is then found by:
U.C.B. │ Frequency
───────────────┼──────────
19.5 │ 2
29.5 │ 16
39.5 │ 37
┌─ 44.5 │ 71
+…└─► median │ 90.5
49.5 │ 110
59.5 │ 152
69.5 │ 165
79.5 │ 174
89.5 │ 178
99.5 │ 180
Median = 44.5 + … = ...
Step 6: Q1 is the (¼n + ½)th value {some schools wrongly say it is the ¼(n+1)th value}
n = 180; so the Q1 is the 45.5th value
Note: As n is so large, you could just use ¼n for the Q1 (i.e. the 45th value)
We use the same method as we did to find the median, firstly making space within the
C.F. table to insert this:
U.C.B. │ Frequency
───────────────┼──────────
19.5 │ 2
29.5 │ 16
39.5 │ 37
Q1 │ 45.5
44.5 │ 71
49.5 │ 110
59.5 │ 152
69.5 │ 165
79.5 │ 174
89.5 │ 178
99.5 │ 180
And then using "interpolation" again…
Which gives: Q1 = 40.75, Q2 = 90.5, Q3 = 55.07
Note: You get slightly different answers for Q1, Q2 and Q3 if you use ¼n, ½n and ¾n to find them,
but the examiner will accept either - this is stats and approximations are part of the game!
(Q3 - Q2) = 8.57
(Q2 - Q1) = 6.25
(Q3-Q2) > (Q2-Q1), which shows "slight +ve skew"
Part (c): Question does not ask us to find outliers - so we won't bother
Box-plot: min = 9.5; Q1 = 40.75; Q2 = 47; Q3 = 55.07; Max = 94.5
Note: (for clever students only) It's not really correct to use the mid-values of the 1st and last classes
for the min and max values…
The proper thing to do with grouped data is to find the 5th percentile (P5)
and the 95th percentile (P95)
The 5th percentile is the ( 5 × n)th value (i.e. the 9th value)
100
We then use the same method as above (interpolation) to estimate this: P5 = 19.5 + 6.43 = 25.93
The 95th percentile is the ( 95 × n)th value (i.e. the 171th value)
100
We then use the same method as above (interpolation) to estimate this: P95 = 69.5 + 6.67 = 76.17
When we use the 5th and 95th percentiles (instead of the actual lowest and highest values),
we draw out box-plot slightly differently, using arrows at then ends:
┌──────────┬──────────┐
◄────────────┤ │ ├────────►
		|             └──────────┴──────────┘         |
	┬───────|──┬──────────┬──────────┬──────────┬─────────|┬──────────┬──────────┬──────────┬
 		P5 	      Q1 	 Q2 	    Q3 	      P95

        Instead of:
	 	              ┌──────────┬──────────┐
	        ├─────────────┤          │          ├─────────┤
		|             └──────────┴──────────┘         |
	┬───────|──┬──────────┬──────────┬──────────┬─────────|┬──────────┬──────────┬──────────┬
 		P5 	      Q1 	 Q2 	    Q3 	      P95
Part (d): The 1st and last classes are "OPEN ENDED"
If we want to find the mean and S.D. then we have to guess the ends of these classes first
These 'guesses' will affect the answers…
But, the ends of the 1st and last class do not affect the median and quartiles which is why
we prefer them in cases where there are ‘open-ended classes’
2. Jun 95 / T1(new) - Qu 5:
The table gives the ages of the population in a town:
Age │ 0-4 5-15 16-44 45-64 65-79 80+
─────────────────────┼──────────────────────────────────────────────
Number (thousands) │ 260 543 1727 756 577 135
A histogram was drawn. The 0-4 age group was represented by a bar of width 0.5 cm and height 5.2 cm
(a): Find the widths and heights of the following groups:
i} 16-44 ii} 65-79
(b): Taking the mid-point of the last group to be 90 years, estimate the mean
3. Jan 96 / T1(new) - Qu 7:
The weekly incomes in £ of households in 11 regions of the UK are:
255.8 252.0 270.6 298.4 362.3 297.2 266.8 261.7 247.5 259.1 220.6
(a): Find the median and quartiles
(b): Identify any possible outliers and draw a box and whisker plot
(c): Describe the skewness
(d): Calculate the mean and S.D.
Further investigations suggested the £362.3 value was in fact £326.3
(e): Without carrying out any further calculations, state what effect this change would have on:
i} The S.D.
ii} The I.Q.R.
Clues:
Part (a): Step 1: Write the list in numerical order:
220.6 247.5 252.0 255.8 259.1 261.7 266.8 270.6 297.2 298.4 362.3
└─────────────────────────────────────┬─────────────────────────────────────┘
n = 11
Step 2: Q1 is the ½(n+1)th value; Q2 is the (¼n+½)th value, Q3 is the (¾n+½)th value:
Q1 (3¼ ≈ 3rd value) –› 252.0
Q2 (6th value) –› 261.7
Q3 (8¾ ≈ 9th value) –› 297.2
Part (b): I.Q.R. = 45.2
Outliers are value that are outside these limits:
Q1 - 1.5×IQR = 184.2 Q3 + 1.5×IQR = 365
So, outliers: x < 184.2 or x > 365
There are no outliers detected
Box-plot: Min = 220.6; Q1 = 252; Q2 = 261.7; Q3 = 297.2; Max = 362.3
Part (c): Q3 - Q2 = 35.5
Q2 - Q1 = 9.7
=> Strong +ve skew
Part (d): To find the mean:
Adding up all the data: ∑x = ... n = 11
mean = ... = 272
11
To find the variance:
First find ∑x² by squaring all of the values and then adding them up: ∑x² = ...
Variance = ... - (272)² = ...
11
S.D. = √... = 35.28
Part (e): Adding Data: Effect on the mean:
Adding in values above the mean increases the mean
Adding in values below the mean decreases the mean
Adding data: Effect on the S.D:
Adding in values that are further than one S.D. from the mean increases S.D.
Adding in values that are within one S.D. of the mean decreases S.D.
Removing Data: In each case, the effect is opposite when removing data
In this case, we are removing a data point that is more than one S.D. above the mean
and replacing it with a data point that is closer to the mean
Part i} => The S.D. would reduce
Adding / Removing Data: Effect on the Median & IQR:
Adding / Removing values below Q1 or above Q3 has NO EFFECT on median & IQR
Adding in values between Q1 & Q3 always decreases the IQR
Adding in values between Q1 & Q2 decreases the median
Adding in values between Q2 & Q3 increases the median
Part ii} => The I.Q.R. would be unchanged
4. Jun 96 / T1 - Qu 5:
A consumer group is investigating telephone usage within a particular city
The number of telephone units, x, used in a particular quarter by a random sample of 250 households
were summarised in a grouped frequency table
In order to simplify the arithmetic the data in the table were coded such that:
y = x - 290 giving ∑fy = -40 and ∑fy² = 1075
10 .
(a): Find estimates of the mean and variance of the number of telephone units used
(b): Suggest two ways in which the estimates in (a) might be improved
5. Jan 97 / T1 - Qu 3:
Children in two classes (A & B) were given set set of arithmetic problems to solve
Their times are summarised below:
│ Class A │ Class B
────────────────┼───────────────┼──────────
Smallest value │ 5 │ 10
Largest value │ 27 │ 26
Q1 │ 9 │ 13
Q2 │ 15 │ 15
Q3 │ 18 │ 22
(a): Draw box plots for both, using the same scale
(b): Compare the results
Clues:
Part (a): You need to draw the two box-plots above a single axis, like this:
┌─────┬─────────────────┐
Class B ├────────┤ │ ├───────────┤
| └─────┴─────────────────┘ |
| | | | |
┌─────────────────┬─────┐ | |
Class A ├───────────┤ | | │ ├──────────────────────────┤
| └─────────────────┴─────┘ | | | |
┬───────────┬──|────────┬──|──|─────┬──|─────|──┬──|─────┬─────|─────┬─────|──|──┬
0 4 5 8 9 10 12 13 15 16 18 20 22 24 26 27 28
Part (b): ● Medians same: i.e. on average they take the same time
● IQRs same: i.e. spread of data is same for both classes
● A has -ve skew: i.e. mean for class A is lower than median
B has +ve skew: i.e. mean for class B is higher than median
● Range greater for class A: i.e. wider range of abilities in class A
6. Jun 97 / T1 - Qu 3:
The 30 members of Darton orchestra each recorded the amount of individual practice, x hours,
they did in the 1st week of June:
∑x = 225 ∑x² = 1755
The mean of these data was μ and the S.D. was σ
(a): Find μ
(b): Find σ
Two new people joined and the number of hour of practice they did were μ-2σ and μ+2σ
(c): State the effect of including these two members on the mean and S.D.
7. Jan 98 / T1 - qu 6:
The times that 136 runners took to complete a course were recorded to the nearest minute
The winner took 23 minutes and the loser took 78 minutes:
Time │ 20-29 30-39 40-49 50-59 60-69 70-79
──────┼──────────────────────────────────────────────
Freq │ 7 21 42 37 20 9
(a): Use interpolation to estimate the median
The upper and lower quartiles are 58.1 & 40.9
(b): Draw a box and whisker plot
(c): Comment on the skewness
Assume that the time taken follows a normal distribution and, using only the values of the upper
and lower quartiles given to find:
(d): the mean of the distribution
(e): the S.D. of the distribution
Clues:
Part (a): Step 1: Make sure all of the classes are closed:
In this table, there are no "open classes"; so we can skip this step…
Step 2: Make sure the data is written using CLASS BOUNDARIES:
In this table, the 1st class ends at ‘29’, but the second class starts at ‘30’
There should be no gap between the end of one class and the start of the next class!
So, to convert to CLASS BOUNDARIES, we use the number halfway between the end of
each class and the start of the next class (so in that case, halfway between 29 & 30
would be 29.5)
Note: The method is different if the variable is AGE, because AGE is always rounded down
Time │ 19.5-29.5 29.5-39.5 39.5-49.5 49.5-59.5 59.5-69.5 69.5-79.5
──────┼──────────────────────────────────────────────────────────────────────────
Freq │ 7 21 42 37 20 9
Step 3: To find the MEDIAN, we need a Cumulative Frequency Table:
Use the UPPER BOUNDARY of each class and the ‘running total’ of the frequencies
U.C.B.│ 19.5-29.5 29.5-39.5 39.5-49.5 49.5-59.5 59.5-69.5 69.5-79.5
──────┼──────────────────────────────────────────────────────────────────────────
Freq │ 7 28 70 ... ... ...
Step 4: The median is the ½(n+1)th value:
n = 136; so the median is the 68.5th value
Note: As n is so large, you could just use ½n for the median (i.e. the 68th value)
Make space within the C.F. table to insert this:
U.C.B.│ 29.5 39.5 median 49.5 59.5 69.5 79.5
──────┼──────────────────────────────────────────────────────────────
Freq │ 7 28 68.5 70 ... ... ...
Step 5: Use "interpolation":
Find the ‘differences’ and use: small difference = small difference
big difference big difference
┌────── +10 ─────┐
┌── +x ──┐ │
│ ▼ ▼
U.C.B.│ 29.5 39.5 median 49.5 59.5 69.5 79.5
──────┼──────────────────────────────────────────────────────────────
Freq │ 7 28 68.5 70 ... ... ...
│ ▲ ▲
└ +40.5 ─┘ │
└───── + 42 ─────┘
So: x = 40.5
10 42 .
x = ...
Median = 39.5 + x = ...
Note: You get slightly different answers for Q1, Q2 and Q3 if you use ¼n, ½n and ¾n to find them,
but the examiner will accept either - this is stats and approximations are part of the game!
Part (b): The question does not ask us to find outliers, so we wont bother…
(If we did bother, we'd find outliers are x < 15.1 or x > 83.9 => none)
Box-plot: min = 24.5; Q1 = 40.9; Q2 = 49.1; Q3 = 58.1; max = 74.5
Part (c): Q3 - Q2 = 9
Q2 - Q1 = 8.2
=> slight +ve skew
Part (d): Let X = time taken to run the course
X ~ N(μ, σ²)
Since 1/4 of the data must be below Q1: p(X < 40.9) = 0.25
Convert to Z: p(Z < 40.9 - μ) = 0.25
σ
40.9 - μ = Ф-1(0.25)
σ
40.9 - μ = -0.67 => 40.9 - μ = -0.67σ . . . . (1)
σ
Since 3/4 of the data must be below Q3: p(X < 58.1) = 0.75
Convert to Z: p(Z < 58.1 - μ) = 0.75
σ
58.1 - μ = Ф-1(0.75)
σ
58.1 - μ = ... => 58.1 - μ = ...σ . . . . (2)
σ
Solving simultaneously (i.e. subtracting) => μ = ..., σ = ...
8. Jun 98 / T1 - Qu 4:
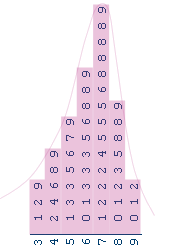
The blood glucose levels in mmol/l of a patient are summarised:
┌────────────────────┐
5| 0 0 1 1 1 2 2 3 3 3 4 4 [12] │ Key: 5|0 means 5.0 │
5| 5 5 6 6 7 8 8 9 9 [ 9] └────────────────────┘
6| 0 1 1 1 2 3 4 4 4 4 [10]
6| 5 5 6 7 8 9 9 [ ]
7| 1 1 2 2 2 3 [ ]
7| 5 7 9 9 [ ]
8| 1 1 1 2 2 3 3 4 [ ]
8| 7 9 9 [ 3]
9| 0 1 1 2 [ 4]
9| 5 7 9 [ 3]
total: [ ]
(a): Fill in the missing numbers
(b): Find the median and quartiles
(c): Draw a box-plot
(d): Comment on the skewness
9. Jan 99 / T1 - Qu 9:
Wigg and Penn solicitors monitored the time, to the nearest minute, spent on consultations
with a sample of 120 clients:
Time │ Number of Clients
──────────┼───────────────────────
10-14 │ 2
15-19 │ 5
20-24 │ 17
25-29 │ 33
30-34 │ 27
35-44 │ 25
45-59 │ 7
60-89 │ 3
90-119 │ 1
──────────┼───────────────────────
Total │ 120
(a): Estimate the median and quartiles
(b): Comment on the skewness
(c): Explain why the data is consistent with the distribution of times you might expect in this situation
(d): Estimate the mean and variance
The solicitors are undecided whether to use median and quartiles or mean and standard deviation
(e): Explain which pair they should use
(f): Given the least time spent was 12 minutes and the longest was 116 minutes, draw a box-plot
Law and Court, another group of solicitors found the least time they spent was 20 minutes, the longest
was 40 minutes and the quartiles were 24, 30 and 36 minutes.
(g): Add another box-plot to your scale
(h): Compare them
Clues:
Part (a): Step 1: Make sure all of the classes are closed:
In this table, there are no "open classes"; so we can skip this step…
Step 2: Make sure the data is written using CLASS BOUNDARIES:
In this table, the 1st class ends at ‘14’, but the second class starts at ‘15’
There should be no gap between the end of one class and the start of the next class!
So, to convert to CLASS BOUNDARIES, we change both of these to 14.5
Note: The method is different if the variable is AGE, because AGE is always rounded down
Time │ 9.5 - 14.5 14.5 - 19.5 ... ... etc
──────┼─────────────────────────────────────────────────────────────────
Freq │ 2 5 ... ... etc
Step 3: To find the MEDIAN, we need a Cumulative Frequency Table:
Use the UPPER BOUNDARY of each class and the ‘running total’ of the frequencies
U.C.B.│ 9.5 - 14.5 14.5 - 19.5 ... ... etc
──────┼─────────────────────────────────────────────────────────────────
Freq │ 2 5 ... ... etc
Step 4: The median is the ½(n+1)th value:
n = 120; so the median is the 60.5th value
Note: As n is so large, you could just use ½n for the median (i.e. the 60th value)
Make space within the C.F. table to insert this:
U.C.B.│ 14.5 19.5 24.5 29.5 Q2 34.5 etc
──────┼─────────────────────────────────────────────────────────────────
Freq │ 2 7 24 57 60.5 84 etc
Step 5: Use "interpolation":
Find the ‘differences’ and use: small difference = small difference
big difference big difference
┌─────── +5 ──────┐
┌── +x ──┐ │
│ ▼ ▼
U.C.B.│ 14.5 19.5 24.5 29.5 Q2 34.5 etc
──────┼──────────────────────────────────────────────────────────────
Freq │ 2 7 24 57 60.5 84 etc
│ ▲ ▲
└─ +3.5 ─┘ │
└────── + 27 ─────┘
So: x = ...
Median = 29.5 + x = ...
Similarly; Q1 = ... & Q3 = ...
Note: You get slightly different answers for Q1, Q2 and Q3 if you use ¼n, ½n and ¾n to find them,
but the examiner will accept either - this is stats and approximations are part of the game!
Part (b): Q3 - Q2 = ... & Q2 - Q1 = ... => +ve skew
Part (c): +ve skew occurs often occurs when there is a practical lower limit that ‘x’ cannot fall below
(it is impossible to have one less than 0 mins), BUT there is no upper limit to ‘x’
In this case, occasionally meetings can last a very long time…
In such cases, you find the mean is greater than the median
Part (d): To find the mean for a table of grouped data:
Step 1: Make sure all of the classes are closed:
In this table, there are no "open classes"; so we can skip this step…
Step 2: Make sure the data is written using CLASS BOUNDARIES:
We did this already in part (a)
Step 3: To find the MEAN, we first need to find the mid-values of each class:
mid-values │ 12 17 … … … 39.5 52 74.5 104.5
───────────┼──────────────────────────────────────────────────────────────
Frequency │ 2 5 17 33 27 25 7 3 1
Step 4: Then we need to multiply the mid-values by the frequencies (call this new row: ‘xf’):
x │ 12 17 … … … 39.5 52 74.5 104.5
───────────┼──────────────────────────────────────────────────────────────
f │ 2 5 17 33 27 25 7 3 1
───────────┼──────────────────────────────────────────────────────────────
xf │ 24 85 ... ... ... ... ... ... 104.5
Step 5: Add up the frequencies (call this ‘n’)
Add up the ‘xf’ row, call this ∑x (or you can call is ∑xf, its the same thing really)
x │ 12 17 … … … 39.5 52 74.5 104.5
───────────┼────────────────────────────────────────────────────────────── ┌──────────┐
f │ 2 5 17 33 27 25 7 3 1 │ n = 120 │
───────────┼────────────────────────────────────────────────────────────── ╞══════════╡
xf │ 24 85 ... ... ... ... ... ... 104.5 │ ∑x = ... │
└──────────┘
Step 6: The mean (called x) is found by dividing these: x = ∑x
n
So, in this case, x = ...
And, to find the variance:
Step 7: Square all the mid-values:
x² │ 144 289 … … … … 2704 … …
───────────┼──────────────────────────────────────────────────────────────
Frequency │ 2 5 17 33 27 25 7 3 1
Step 8: Multiply the x² values by the frequencies (call this new row ‘x²f’)
Add up the frequencies (call this ‘n’)
Add up the ‘x²f’ row, call this ∑x² (or you can call is ∑x²f)
x² │ 144 289 … … … … 2704 … …
───────────┼────────────────────────────────────────────────────────────── ┌──────────┐
Frequency │ 2 5 17 33 27 25 7 3 1 │ n = 120 │
───────────┼────────────────────────────────────────────────────────────── ╞══════════╡
x²f │ 288 1445 ... ... ... ... 18928 ... 104.5 │ ∑x²= ... │
└──────────┘
Step 6: The variance is found using the equation: Variance = ∑x² - (x)²
n
For this data: ∑x² = 147171.25
Variance = 147171 - (...)² = ...
120
Part (e): For skewed grouped data, it is better to use the median and quartiles because, to find the mean
and S.D. we use "mid-values". Using mid-values assumes the data in each class is symmetrically
distributed. But, since the data as a whole is skewed, that assumption is likely to be wrong
and produce bias. Using median and quartiles avoids the whole "mid-value" fiasco…
Note: That's a full explanation, so you understand. But, in the exam, you can just say:
"For skewed data, the use of mid-values produces bias, so mean & SD are preferred"
Part (h): The correct order for comparing box-plots is: Compare medians, then spreads, then skewness
Lastly (and not very important) is the range:
● The average amount of time spent with the client is roughly the same
● The spread of times spent with clients is roughly the same
● L&C's data is symmetrical - so the mean is the same as the median
W&P's data is +vely skewed - so the mean is time spent is higher
● The range is much higher for W&P which means they have a few very
strange clients (who like to stay ages or like to leave quickly)
10. Jun 99 / T1 - Qu 8:
The birth weights of a sample of 100 babies are summarised:
Weight (kg) │ Number of Babies
─────────────┼──────────────────
1.0- │ 12
1.4- │ 17
1.6- │ 23
1.8- │ 14
2.0- │ 10
2.2- │ 9
2.4- │ 8
2.8- │ 4
3.2-3.8 │ 3
(a): Write down the upper class boundary of the 1st class
(b): Represent these data by a histogram
(c): Estimate the number of babies whose birth weight was 2.1-2.5 kg
(d): Estimate the mean and S.D.
(e): Estimate the median and quartiles
(f): Comment on the skewness
(g): State which of (d) or (e) you would recommend and why
11. Jan 00 / T1 - Qu 8:
A random sample of the marks students scored in an accountancy exam is to be taken
(a): Suggest a suitable
i} sampling unit
ii} sampling frame
The mark x obtained by 45 students was recorded:
┌────────────────────┐
5| 0 1 3 3 4 4 [ 6] │ Key: 5|3 means 53 │
5| 5 6 7 9 [ 4] └────────────────────┘
6| 1 1 3 3 4 4 4 [ 7]
6| 5 7 8 8 9 [ 5]
7| 3 3 4 4 4 4 [ 6]
7| 5 5 6 6 7 7 7 7 8 8 8 9 9 [13]
8| 0 0 1 1 [ 4]
(b): Construct a box-plot of these data
(c): Comment on the skewness
(d): Given ∑x = 3085 and ∑x² = 215,569 find the mean and S.D.
The mean and S.D. of all the students who sat the exam were 65 and 16.5
The examiners decided the marks of each student should be scaled by having 10 marks subtracted
and then reduced by a further 10%
(e): Find the mean and S.D. of the scaled marks
(f): Charlie's scaled mark was 46%. What was his actual mark
Clues:
Part (a): The proper way to take a ‘random sample’ is:
● Start with a numbered list of all of the people you are investigating (called a sample frame)
● Use a random number generator to pick a person at random from the list
i} The people in the list are the ‘sampling units’ (it isn't always the case that the list is
of people, it may be a list of cars
So, in this case, the ‘sampling units’ are the individual students
ii} In this case, the ‘sampling frame’ is the list of exam entrants
Part (b): n = 45 Q1 (12th value) = 61
Q2 (23rd value) = ...
Q3 (34th value) = ...
Part (e): We want to transform the marks (x) to scaled marks (y):
x -----> -10 -----> ×0.90 -----> y
The mean gets transformed in the same way:
x = 68.56
↓
x -----> -10 -----> ×0.90 -----> y
↓
y = ...
But, adding/subtracting doesn't affect the S.D:
σx = 9.52
↓
σx -----> -10 -----> ×0.90 -----> σy
↓
σy = ...
Part (f): De-coding the mark from ‘y’ back to ‘x’:
x -----> -10 -----> ×0.90 -----> y
x <----- +10 <----- ÷0.90 <----- y
Putting y = 46 into this de-coding equation:
y = 46
↓
x <----- +10 <----- ÷0.90 <----- y
↓
x = ...
12. Jun 00 / T1(old) - Qu 9:
The times to the nearest minute the children of two classes spent reading on a particular day are
summarised below:
┌─────────────────────────────────┐
Class A Class B │ Key: 0|2|2 means: 20 in Class A │
[0] |1| 7 9 [2] │ and 22 in Class B │
[6] 9 7 7 4 2 0 |2| 2 3 4 4 8 [5] └─────────────────────────────────┘
[7] 9 8 7 5 5 3 1 |3| 1 2 3 3 4 7 8 [ ]
[7] 8 5 3 3 3 1 1 |4| 1 2 2 3 7 7 9 [7]
[ ] 8 6 2 1 |5| 2 4 4 7 9 9 [6]
[4] 7 4 3 2 |6| 0 1 1 4 [4]
[2] 5 2 |7| [0]
[ ] Total Total [ ]
(a): Fill in the blanks
(b): Fill in the values for r, s, t,u & v in this table:
│ Class A │ Class B
───────────────────┼───────────────┼──────────
Smallest value │ 20 │ r
Largest value │ s │ 64
Q1 │ 33 │ t
Q2 │ u │ 42
Q3 │ 56 │ v
(c): One the same scale, draw box-plots for both classes
(d): Compare
For Class B the total number of minutes spent reading by the whole class was 1287 and
the sum of the squares was 59493
(e): Find the mean and S.D. of Class B
(f): Comment on whether the values found in part (e) are consistent with your box-plot
13. Jan 01 / T1(old) - Qu 8:
A group of children took part in a charity swim
The length of time in the water to the nearest minute was recorded:
U.C.B.│ 4.5 14.5 24.5 29.5 34.5 39.5 49.5 59.5
──────┼─────────────────────────────────────────────────────────────
C.F. │ 0 25 52 87 125 158 181 200
(a): Draw a histogram of these data
(b): Explain how you might model the length of time spent in the water
(c): Estimate the median and quartiles
(d): Comment on the skewness
The mid-points are denoted by x
Using the coding: y = x - 32 gives ∑fy = -78 and ∑fy² = 5086
2.5 .
(e): Estimate the mean and S.D. of the time spent in the water
Clues:
Part (a): They've given us a ‘Cumulative Frequency Table’ (required for a cumulative frequency curve),
but then they've asked us to draw the histogram! Clearly, they are checking we know how to
get back from the C.F. table to a normal frequency table:
Step 1: Change the U.C.B.s to class boundaries:
U.C.B.│ 0-4.5 4.5-14.5 14.5-24.5 24.5-29.5 29.5-34.5 34.5-39.5 39.5-49.5 49.5-59.5
──────┼──────────────────────────────────────────────────────────────────────────────────
C.F. │ 0 25 52 87 125 158 181 200
Step 2: By looking at the differences between the numbers in the C.F. row; find the frequencies
U.C.B.│ 0-4.5 4.5-14.5 14.5-24.5 24.5-29.5 29.5-34.5 34.5-39.5 39.5-49.5 49.5-59.5
──────┼──────────────────────────────────────────────────────────────────────────────────
C.F. │ 0 25 52 87 125 158 181 200
└──+25───┘└──+27────┘└──+35────┘└───+38───┘└──+33────┘└──+23────┘└──+19────┘
Step 3: So now you can form a Frequency Table and work out the Frequency Densities:
x │ 0-4.5 4.5-14.5 14.5-24.5 24.5-29.5 29.5-34.5 34.5-39.5 39.5-49.5 49.5-59.5
──────┼──────────────────────────────────────────────────────────────────────────────────
f │ 0 25 27 35 38 33 23 19
──────┼──────────────────────────────────────────────────────────────────────────────────
f.d.│ 0 2.5 2.7 7.0 ... 6.6 ... 1.9
Step 4: Now draw the histogram (the y-axis is frequency density)
Part (e): So, they've coded the data using the equation: y = x - 32
2.5 .
i.e. x -----> -32 -----> ÷2.5 -----> y
And they've told us: n = 200, ∑y = -78 and ∑y² = 5086
Which makes it easy to find the mean of y: y = -78 = -0.39
200
And the variance of y: Var(Y) = 5086 - (-0.39)² = 25.2779
200
Which means we know the S.D. of y: σy = √25.2779 = 5.0277
We want to de-code from ‘y’ back to ‘x’ and the equation to de-code would be the reverse
of the coding equation:
x -----> -32 -----> ÷2.5 -----> y
x <----- +32 <----- ×2.5 <----- y
The mean gets transformed in the same way:
y = -0.39
↓
x <----- +32 <----- ×2.5 <----- y
↓
x = ...
But, adding/subtracting doesn't affect the S.D:
σy = 5.0277
↓
σx <----- +32 <----- ×2.5 <----- σy
↓
σx = ...
14. Spec 00 / S1(new) - Qu 5:
The distances in km travelled by the teachers in two schools are given below:
┌─────────────────────────────────┐
School A School B │ Key:7|2|5 means: 27 in School A │
[3] 4 4 4 |0| 3 4 4 [ 3] │ and 25 in School B │
[2] 6 5 |0| 5 7 [ 2] └─────────────────────────────────┘
[6] 4 3 2 2 1 1 |1| 0 0 1 2 2 3 [ 6]
[1] 7 |1| 7 7 7 8 8 9 9 [ 7]
[6] 4 3 2 2 1 0 |2| 0 0 1 2 2 3 4 [ 7]
[2] 9 7 |2| 5 5 6 6 7 7 8 8 9 9 [10]
[5] 4 2 2 1 0 |3| 0 1 1 1 3 3 4 4 [ 8]
[3] 9 8 8 |3| 5 6 8 9 [ 4]
[3] 3 1 0 |4| 0 1 [ 2]
[0] |4| [ 0]
[0] |5| [ 0]
[0] |5| 5 [ 1]
[ ] Total Total [ ]
The quartiles for School A are 12, 22, 32
(a): Find the quartiles for School B
(b): Draw a box-plot for School A
Outliers are defined to be outside the limits: Q1 - 1.5IQR and Q3 + 1.5IQR
(c): Using the same scale add a box-plot for School B
(d): Compare
15. Mock 00 / S1(new) - Qu 2:
A botany student counted the number of daisies in each of 42 randomly chosen 1 m² areas:
┌───────────────────┐
1| 1 2 2 3 4 4 4 [7] │ Key: 1|1 means 11 │
1| 5 5 6 7 8 9 9 [7] └───────────────────┘
2| 0 0 1 3 3 3 3 4 [8]
2| 5 5 6 7 9 9 9 [7]
3| 0 0 1 2 4 4 [6]
3| 6 6 7 8 8 [5]
4| 1 3 [2]
(a): Write down the mode
(b): Find the median and quartiles
(c): Draw a box-plot
(d): Comment on the skewness
The student also collected data from another field
(e): Comment on how the student might summarise both sets of raw data before drawing box-plots
16. Jan 01 / S1(new) - Qu 1:
The students in a class were each asked to write down how many CDs they own
The least was 14 and all but one had 60 or fewer. One had 65. The quartiles are 30, 34 and 42
Decide if there are and outliers and draw a box-plot
17. Jan 01 / S1(new) - Qu 5:
The data below summarises the delay in minutes to a sample of 200 motorists at a roadworks:
Delay │ 4-6 7-8 9 10 11-12 13-15 16-20
	──────┼──────────────────────────────────────────────────────
	Number│	15      28      49     53      30      15      10

  (a): Represent using a histogram
  (b): Give a reason for using a histogram
  (c): Use interpolation to find the median
  (d): Estimate the mean and S.D.

  One measure of skewness is:  3(mean - median)
                              standard deviation
  (e): Evaluate this coefficient for the above data
  (f): Explain why the normal distribution may not be an appropriate model for these data

  Clues:

  Part (e): You already know that, for symmetrical data, the mode, median and mean will be the same

	    So, for symmetrical data, the top of this fraction will be ZERO

	    i.e. A coefficient of ZERO means zero skew

	    For positively skewed data, the mean will be higher than the median, so the top of the fraction
	    will be positive

	    i.e. a positive value of the coefficient means positively skewed data


  18. Jun 01/ S1(new) - Qu 1:
  Each of the 25 students on a course recorded the number of minutes, x, spent surfing the internet
  on a given day
  ∑x = 1075 and ∑x²=46,625
  (a): Find μ and σ for these data

  Two other students surfed the internet on the same day and spent 35 and 51 minutes respectively
  (b): Without further calculation, explain the effect on the mean of including these two students


  19. Jun 01/ S1(new) - 6:
  Three swimmers Alan, Diane and Gopal recorded the number of lengths of the swimming pool they swam
  during each practice session. The results for Alan are shown below:
 						┌───────────────────┐
	2| 0 1 2 2                   [ 4]	│ Key: 2|0 means 20 │
	2| 5 5 6 7 7 8 9             [ 7]	└───────────────────┘
	3| 0 1 2 2 4                 [ 5]
	3| 5 6 6 7 9                 [ 5]
	4| 0 1 3 3 3 3 3 4 4 4       [10]
	4| 5 5 6 6 6 7 7 8 8 9 9 9   [12]
	5| 0 0 0                     [ 3]

  (a): Find the three quartiles for Alan's results

  The table summarises the results for Diane and Gopal:

				   │	 Diane	   │    Gopal
		───────────────────┼───────────────┼──────────
		Smallest value	   │	 35	   │	 25
		Lower Quartile	   │	 37	   │	 34
		Median		   │	 42	   │	 42
		Upper Quartile	   │	 53	   │	 50
		Largest value	   │	 65	   │	 57

  (b): Draw three box-plots on the same scale
  (c): Compare


  20. Jan 02 / S1(new) - Qu 2:
  A meteorologist measured the number of hours of sunshine each day for 100 days:

	Hours of Sun │	1	2-4	5-6	 7	8	9-11	12
	─────────────┼────────────────────────────────────────────────────
	Days	     │	16	 32	 28	12	9	 2	 1

  (a): Draw a histogram for these data
  (b): Estimate the number of days that had 6-9 hours of sunshine


  21. Jan 02 / S1(new) - Qu 6:
  The number of babies delivered by 15 male doctors in 1 year are shown:
					┌───────────────────┐
	0|                    [0]	│ Key: 4|5 means 45 │
	1| 9                  [1]	└───────────────────┘
	2| 1 6 7 7            [4]
	3| 2 2 3 4 8          [5]
	4| 5                  [1]
	5| 1                  [1]
	6| 0                  [1]
	7|                    [0]
	8| 6 7                [2]

  (a): Find the median and quartiles
  (b): Given there are no outliers, draw a box-plot
  (c): Calculate the mean and S.D.

  The records also contain the number of babies delivered by 10 female doctors:

	34	30	20	15	6	32	26	19	11	4

  The quartiles are 11, 19.5 and 30
  (d): Add another box-plot to your scale
  (e): Compare


  22. Jun 02 / S1 - Qu 6:
  Bags of compost are labelled as 20kg. A random sample of 50 bags were weighed:

		Weight in kg  │	Frequency
		──────────────┼──────────
		14.6-14.8     │	   1
		14.8-18.0     │	   0
		18.0-18.5     │	   5
		18.5-20.0     │    6
		20.0-20.2     │   22
		20.2-20.4     │   15
		20.4-21.0     │    1

  (a): Draw a histogram of these data
  (b): Using the coding: y = 10(weight in kg - 14) and given that ∑fy² = 171,503.75,
       find the mean and S.D. of the weights
  (c): Use interpolation to estimate the median

  The company decides to put an average weight onto the bags
  (d): Which of these averages would you recommend and why


  23. Nov 02 / S1 - Qu 7:
  The aptitude scores x obtained by all of the applicants for a job:
						┌───────────────────┐
	3│ 1 2 9                         [ 3]	│ Key: 3|1 means 31 │
	4│ 2 4 6 8 9                     [ 5]	└───────────────────┘
	5│ 1 3 3 5 6 7 9                 [ 7]
	6│ 0 1 3 3 3 5 6 8 8 9           [10]
	7│ 1 2 2 2 4 5 5 5 6 8 8 8 8 9   [14]
	8│ 0 1 2 3 5 8 8 9               [ 8]
	9│ 0 1 2                         [ 3]

  (a): Write down the modal aptitude score
  (b): Find the three quartiles for this data
  (c): After checking for outliers, draw a box-plot

  For these data, ∑x = 3363 and ∑x² = 238,305
  (d): Calculate the mean and S.D. to 2 d.p.
  (e): Use two different methods to show these data are negatively skewed

  Clues:

  Part (e): Remember, the stem and leaf diagram is a bit like a histogram (that's the point of using
	    stem and leaf diagram). So, one way we can tell the data is negatively skewed is from the
	    shape of the stem and leaf diagram:


	    A second way is to compare the mode, median and mean, much like we did in question 17, part (e)
	    You don't need to use the formula from question 17, but why not?


  24. Jan 03 / S1 - Qu 1:
  The total amount of time a secretary spent on the 'phone in a day was recorded over 40 days

	Time (mins)   │	 90-139     140-149     150-159     160-169     170-179     180-229
A second way is to compare the mode, median and mean, much like we did in question 17, part (e)
You don't need to use the formula from question 17, but why not?
24. Jan 03 / S1 - Qu 1:
The total amount of time a secretary spent on the 'phone in a day was recorded over 40 days
Time (mins) │ 90-139 140-149 150-159 160-169 170-179 180-229
	──────────────┼────────────────────────────────────────────────────────────────────
	No of days    │	   8          10          10           4           4           4

  Draw a histogram to illustrate these data


  25. Jan 03 / S1 - Qu 4:
  A restaurant owner recorded time customers have to wait before being served for a sample of 20 customers

	15	14	16	15	17	16	15
	14	15	16	17	16	15	14
	16	17	15	25	18	16

  (a): Find the median and IQR
  (b): Draw a box-plot indicating any outliers
  (c): Find the mean
  (d): Comment on the skewness


  26. Jun 03 / S1 - Qu 1:
  A dentist records the time to treat each patient for a sample of 100 patients:

	Time (mins)    │ 4-7       8     9-10     11	 12-16   17-20
	───────────────┼──────────────────────────────────────────────
	No of Patients │  12      20      18      22      15      13

  Draw a histogram to illustrate these data


  27. Jun 03 / S1 - Qu 6:
  The number of bags of potato crisps sold per day in a bar was recorded over two weeks:

	20	15	10	30	33	40	5
	11	13	20	25	42	31	17

  (a): Calculate the mean
  (b): Draw a stem and leaf diagram
  (c): Find the median and quartiles
  (d): Determine if there are any outliers
  (e): Draw a box-plot
  (f): Comment on the skewness


  28. Jan 04 / S1 - Qu 5:
  Daily sales in £ taken at a local newsagents last year are summarised:

	Sales       │  1-200    201-400    401-700    701-1000    1001-1500
	────────────┼──────────────────────────────────────────────────────
	No of days  │   166       100        59          30           5

  (a): Draw a histogram
  (b): Use interpolation to estimate the median and IQR
  (c): Estimate the mean & S.D.

  The newsagent want to compare last year's sales with other years
  (d): State with justification, whether he should use the median and IQR or the mean and S.D.


  29. Jun 04 / S1 - Qu 4:
  The attendance of a group of 18 students was recorded over a 4 week period
  The numbers of students attending each class is listed:

	18	18	17	17	16	17	16	18
	18	14	17	18	15	17	18	16

  (a): Calculate the mean and S.D. Express the mean as a percentage of the 18 students

  In the same 4-week period, the attendance of a different group of 20 students was recorded:

	20	16	18	18	19	15	14	14	15
	18	15	16	17	16	18	15	14

  (b): Construct a back-to-back stem and leaf diagram
  (c): Find the mode, median and IQR for each group

  The mean percentage attendance and S.D. for the 2nd group are 81.25% and 1.82
  (d): Compare these two groups
|